Mosaica
Mosaica is a database for interactive maps of very large sets of points. Give it records that each have a position, such as every place name in a gazetteer, or millions of papers laid out by what their abstracts say, and it serves a map of them that people can pan, zoom, filter and search. Whatever is on screen, the counts and densities are worked out for exactly that view.
It is designed to hold billions of points on one machine and to serve them to many viewers at once. The data can change while it serves. New records appear on the map at the next flush, every 90 seconds by default, and a deletion applies to every request that starts after the server accepts it.
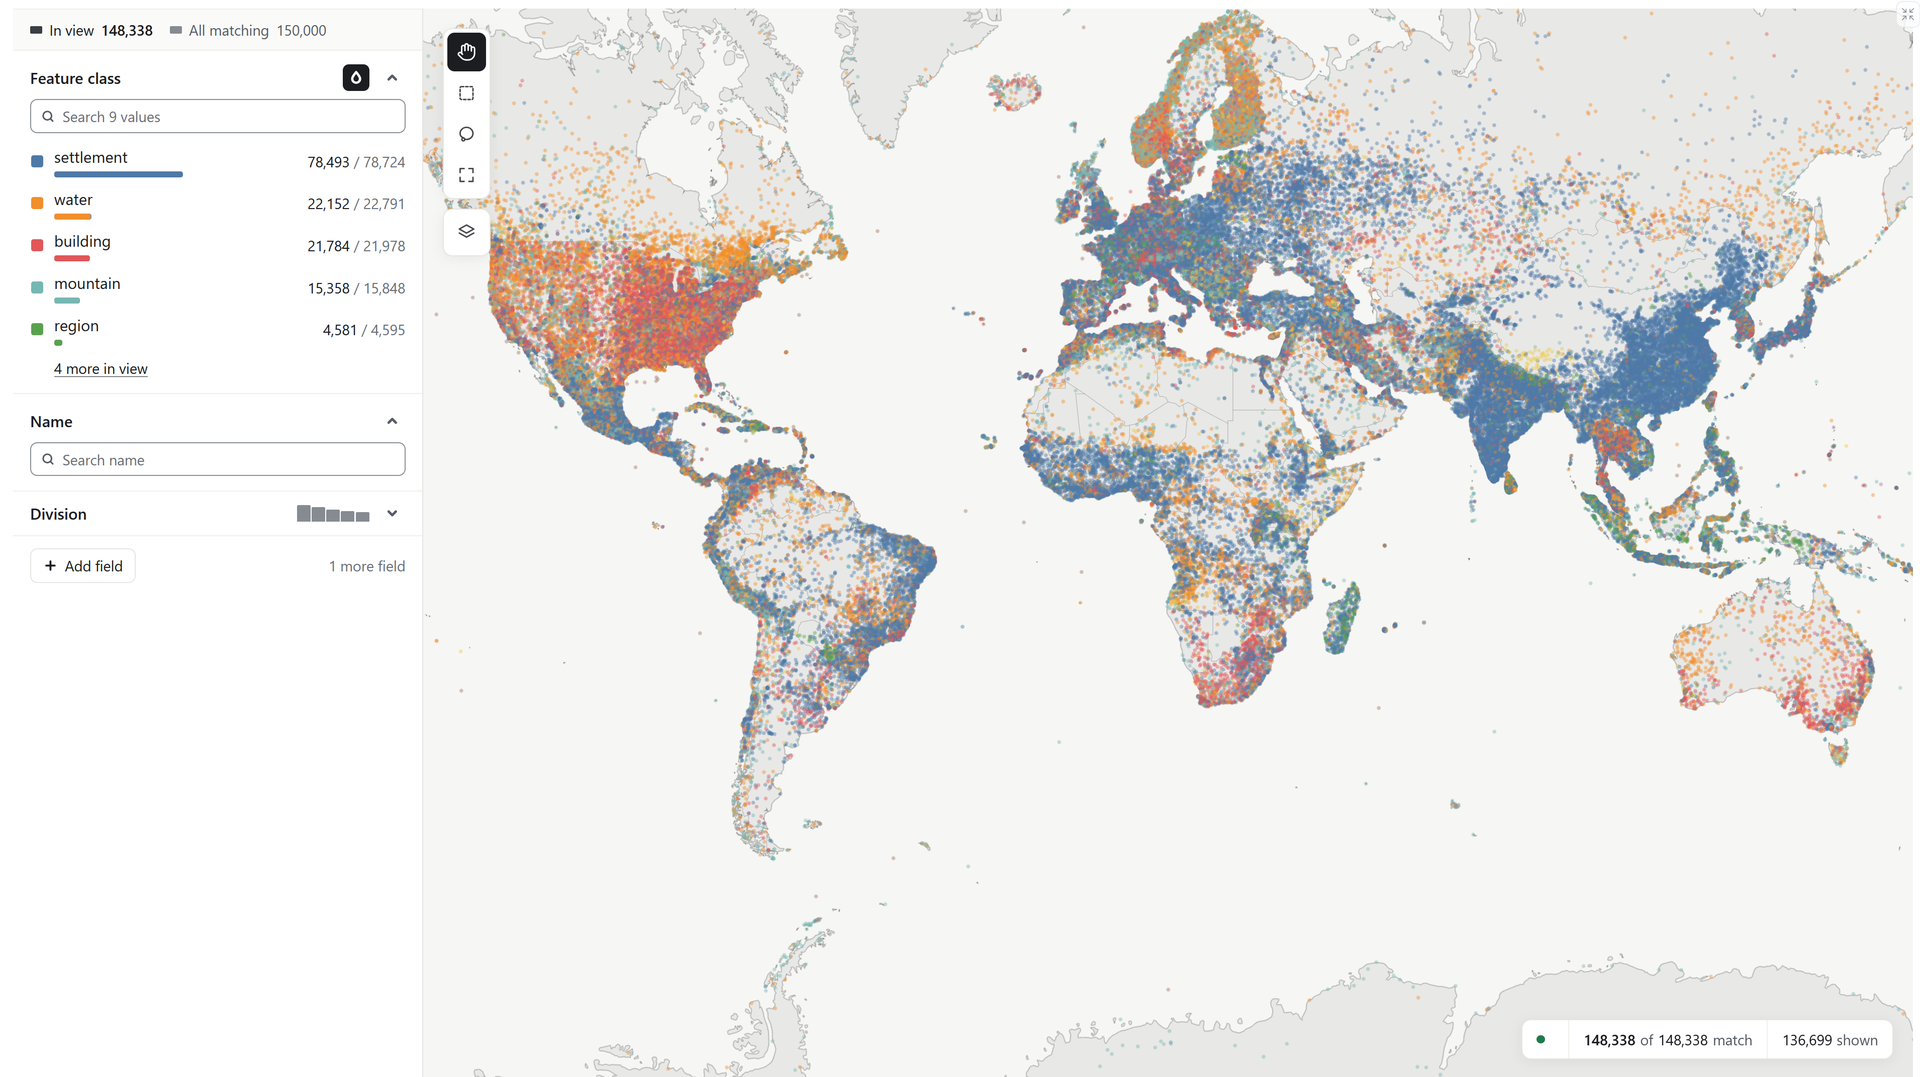
What a map can show
-
Clusters and topics
Draw clusters over the points, each with a count and, if you give one, a title. Nest them into a hierarchy, such as fields, then subfields, then topics, and let viewers colour or filter by any level.
-
Regions and shapes
Add polygons such as country borders, or have the server work out a hull around each cluster's points. The map outlines one when a viewer points at it or opens it.
-
Filters on every kind of field
Ranges on numbers and dates, values of a category, exact or partial matches on keywords, and words in free text. Draw a box or a freehand shape to select an area, and combine any of these with and, or and not.
-
Counts and breakdowns
Count the matching points by category or by cluster, compare them with another set, or divide them into a grid of cells. Every count follows the filters.
-
Several layouts of the same records
Lay one set of records out in several ways, such as on a world map and by an embedding, or one layout per year. A viewer can switch between them and keep their filters.
-
A map for each viewer
Give records access labels, and each viewer sees a map computed only from the records they may see. That covers every count and cluster as well as the points, so no count includes a record the viewer may not see. The security chapter lists what response times can still reveal.
Where to start
- Explore your own data in a notebook. The Python client turns a pandas or polars data frame into a map in Jupyter, and answers counts and filters from code. It runs the database on your own machine, or connects to a shared server. Start with the Python client.
- Run a map that other people open in a browser. Describe your Parquet files, build them with the
mosaicacommand, and serve the result. Your first map from files walks through it, and the Docker and systemd guides cover running it for real. - Put a map inside your own web application. The TypeScript client and its web components add a map, filters and record cards to a page, in any framework, or a layer to your own deck.gl scene. See the TypeScript client and the components.
- Work with it from another language. A running server answers an HTTP API, which both clients are built on. The HTTP API reference describes every route.
About these pages
- Start covers installing and configuring Mosaica, and has tutorials, which take you from nothing to a working map.
- How it works explains the design: how data is stored, how a map is answered, how changes reach a running server, and how each viewer's map is kept to what they may see.
- Guides cover particular jobs, such as running Mosaica under Docker or behind TLS.
- Reference lists every route, command, setting and client call.